MICROSOFT POWER BI
SHOWCASE
Data Stories Come Alive: Experience Analytics
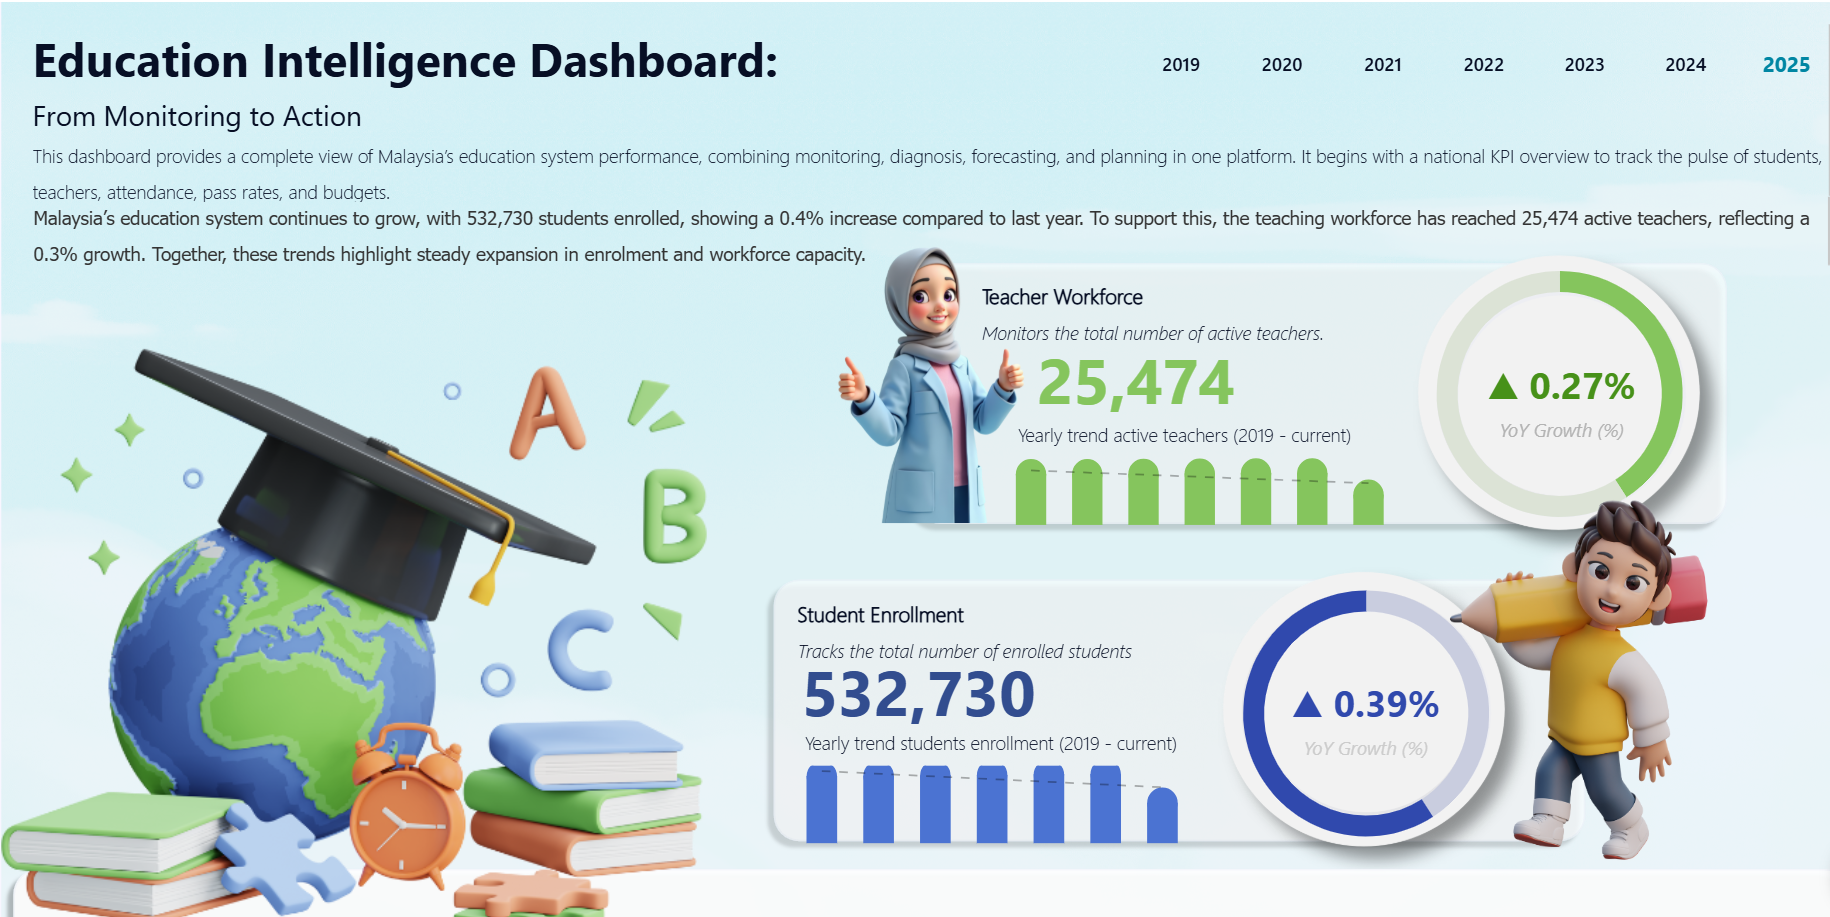
This dashboard provides a complete view of Malaysia’s education system performance, combining monitoring, diagnosis, forecasting, and planning in one platform. It begins with a national KPI overview to track the pulse of students, teachers, attendance, pass rates, and budgets.
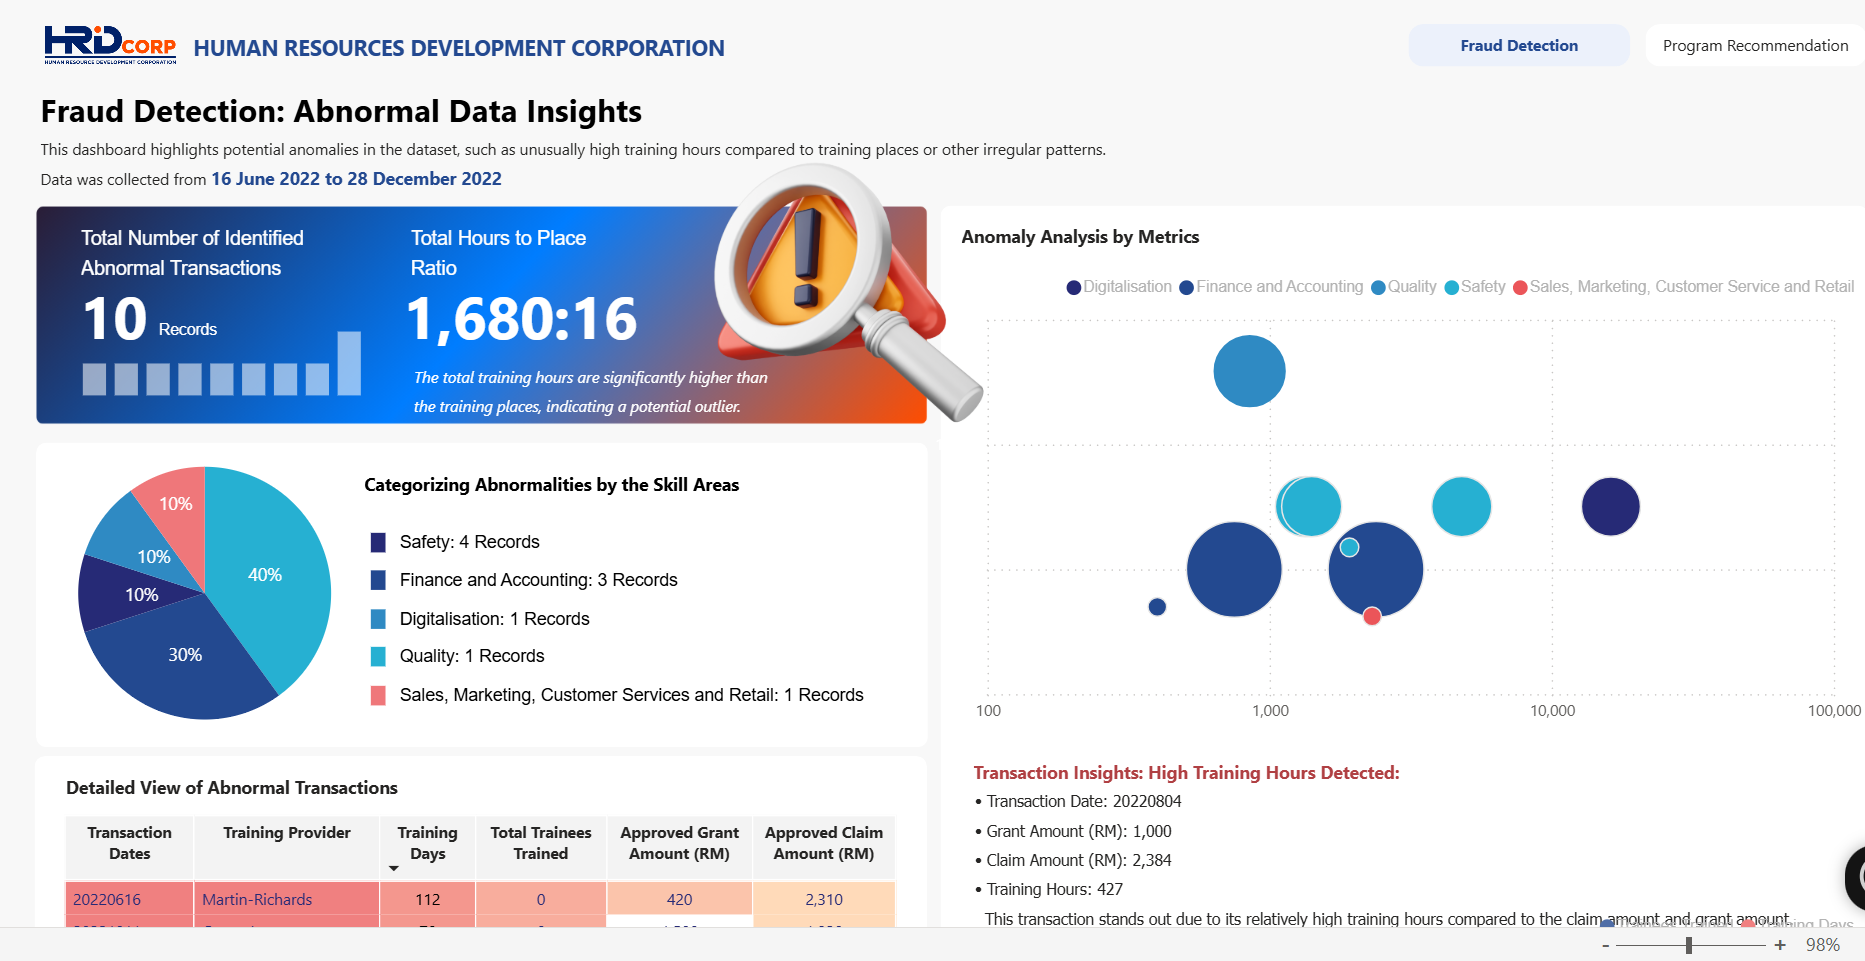
This dashboard highlights potential anomalies in the dataset, such as unusually high training hours compared to training places or other irregular patterns.
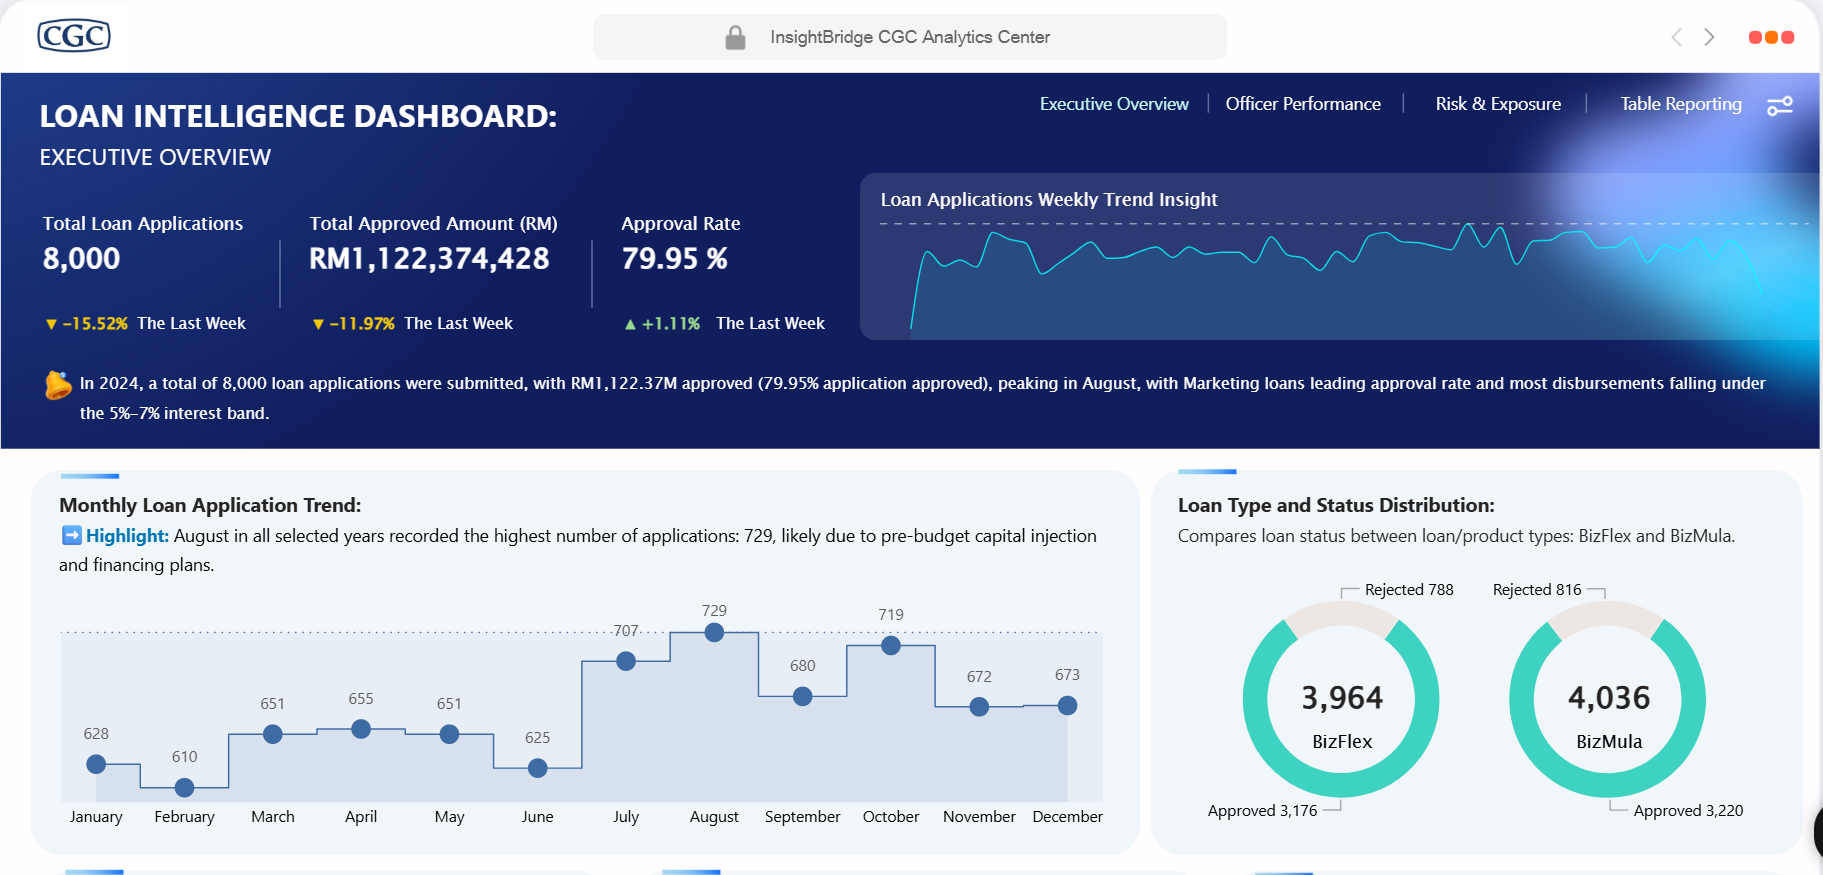
The dashboard gives management insights into loan application volumes, approval performance, loan types, purposes, and interest rate distributions — helping track growth, efficiency, and trends over time.
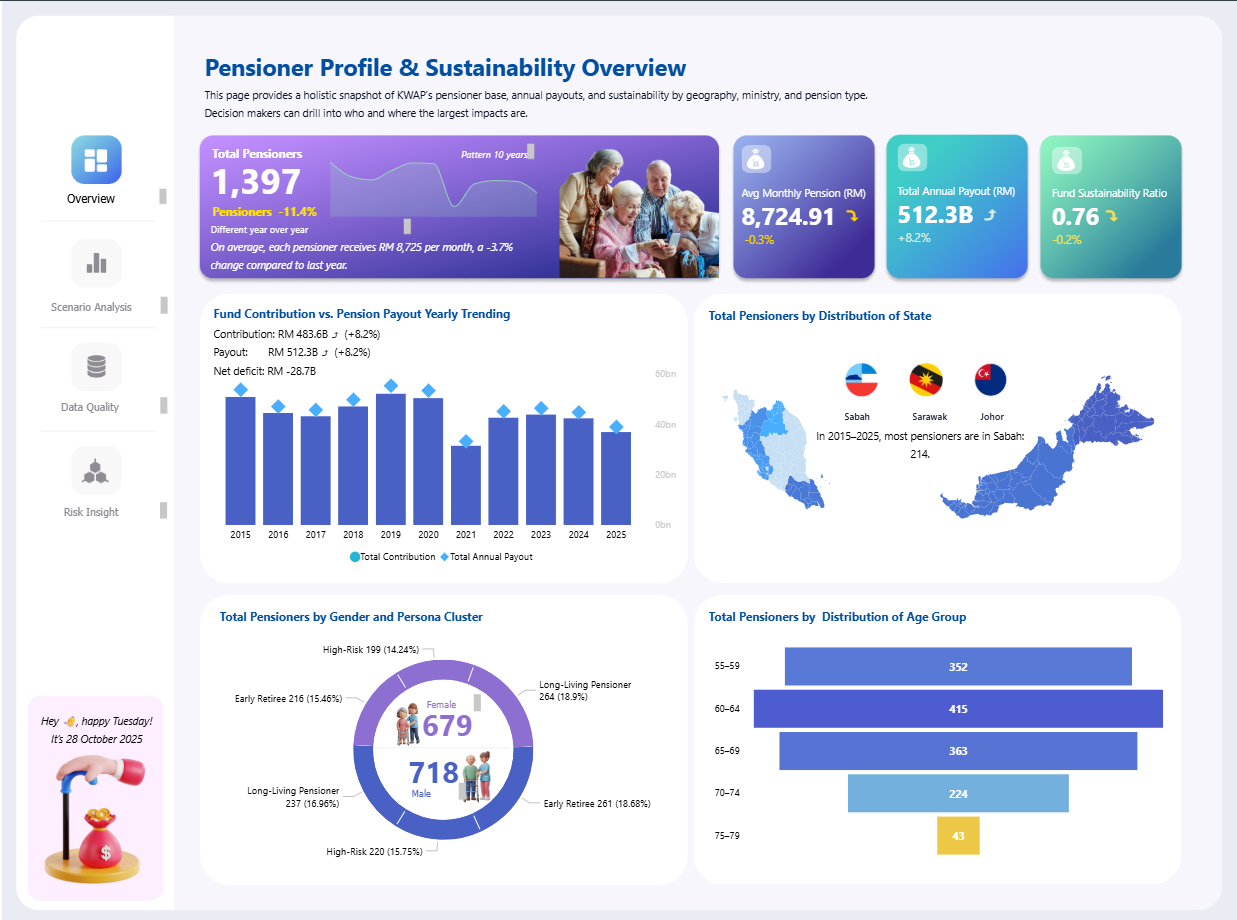
This dashboard provides a holistic snapshot of KWAP’s pensioner base, annual payouts, and sustainability by geography, ministry, and pension type. Decision makers can drill into who and where the largest impacts are.

The NutriConnect: Survey Analysis dashboard is an interactive tool that provides a clear and comprehensive view of nutritional survey results. It helps users explore key insights easily, supporting better decisions to improve nutrition strategies.
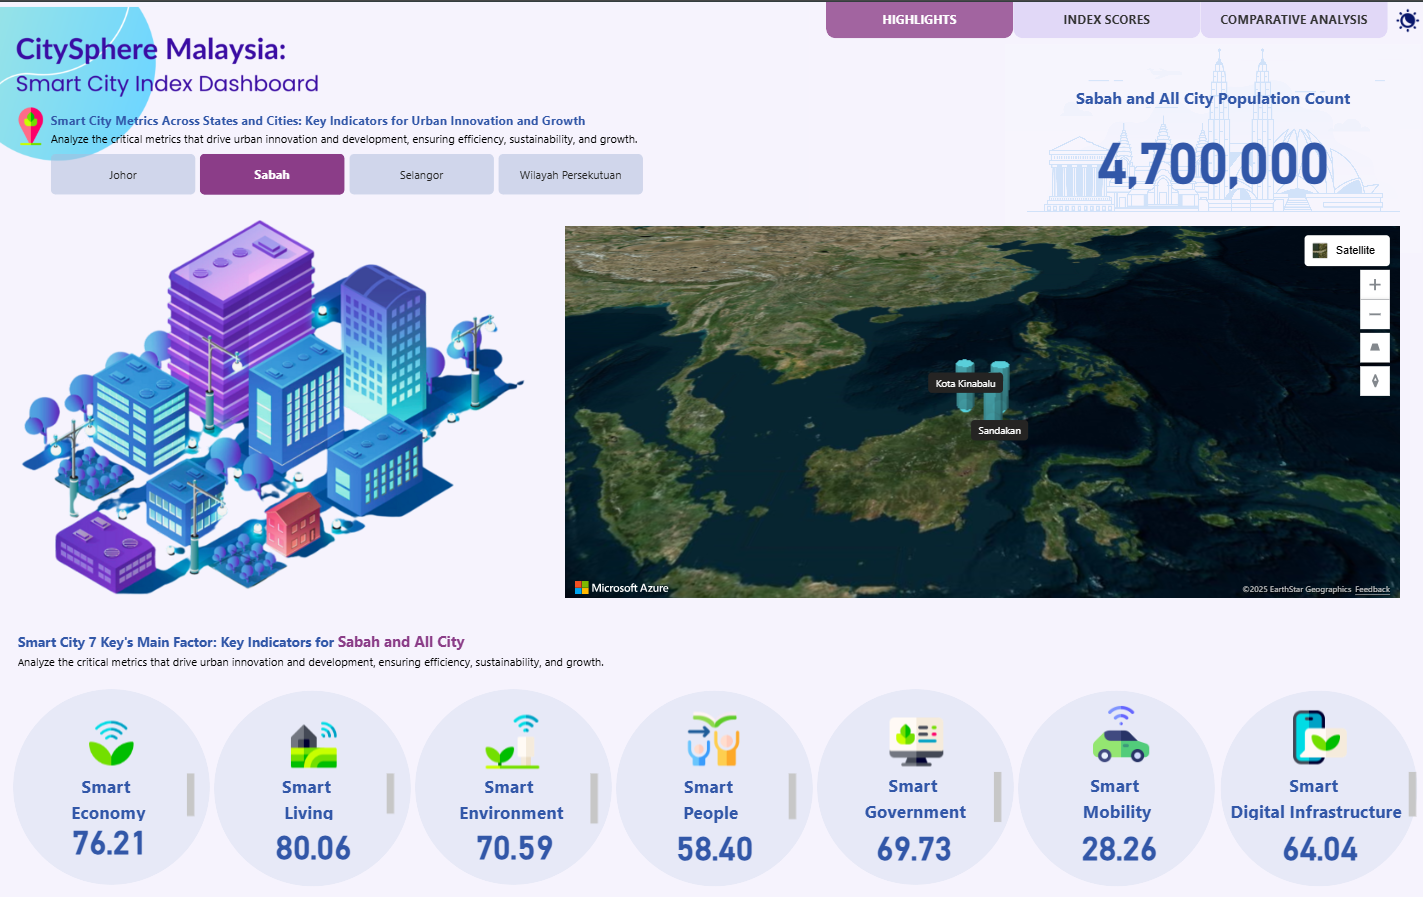
Analyze the critical metrics that drive urban innovation and development, ensuring efficiency, sustainability, and growth.